
Introduction
openpyxl is a Python library to read/write Excel 2010 xlsx/xlsm/xltx/xltm files.
It was born from lack of existing library to read/write natively from Python the Office Open XML format.
All kudos to the PHPExcel team as openpyxl was initially based on PHPExcel.
Security
By default openpyxl does not guard against quadratic blowup or billion laughs xml attacks. To guard against these attacks install defusedxml.
Excel xlsx
In this tutorial we work with xlsx files. The xlsx is a file extension for an open XML spreadsheet file format used by Microsoft Excel. The xlsm files support macros. The xls format is a proprietary binary format while xlsx is based on Office Open XML format.
$ sudo pip3 install openpyxl
We install openpyxl with the pip3 tool.
Openpyxl create new file
In the first example, we create a new xlsx file with openpyxl.
#!/usr/bin/env python

from openpyxl import Workbook
import time

book = Workbook()
sheet = book.active

sheet['A1'] = 56
sheet['A2'] = 43

now = time.strftime("%x")
sheet['A3'] = now

book.save("sample.xlsx")
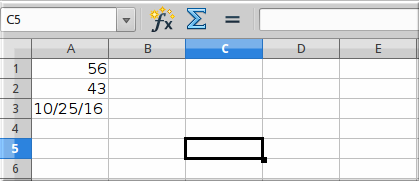
In the example, we create a new xlsx file. We write data into three cells.
from openpyxl import Workbook
From the openpyxl module, we import the Workbook class. A workbook is the container for all other parts of the document.
book = Workbook()
We create a new workbook. A workbook is always created with at least one worksheet.
sheet = book.active
We get the reference to the active sheet.
sheet['A1'] = 56
sheet['A2'] = 43
We write numerical data to cells A1 and A2.
now = time.strftime("%x")
sheet['A3'] = now
We write current date to the cell A3.
book.save("sample.xlsx")
We write the contents to the sample.xlsx file with the save method.
Openpyxl write to a cell
There are two basic ways to write to a cell: using a key of a worksheet such as A1 or D3, or using a row and column notation with the cell method.
#!/usr/bin/env python

from openpyxl import Workbook

book = Workbook()
sheet = book.active

sheet['A1'] = 1
sheet.cell(row=2, column=2).value = 2

book.save('write2cell.xlsx')
In the example, we write two values to two cells.
sheet['A1'] = 1
Here, we assing a numerical value to the A1 cell.
sheet.cell(row=2, column=2).value = 2
In this line, we write to cell B2 with the row and column notation.
Openpyxl append values
With the append method, we can append a group of values at the bottom of the current sheet.
#!/usr/bin/env python

from openpyxl import Workbook

book = Workbook()
sheet = book.active

rows = (
    (88, 46, 57),
    (89, 38, 12),
    (23, 59, 78),
    (56, 21, 98),
    (24, 18, 43),
    (34, 15, 67)
)

for row in rows:
    sheet.append(row)

book.save('appending.xlsx')
In the example, we append three columns of data into the current sheet.
rows = (
    (88, 46, 57),
    (89, 38, 12),
    (23, 59, 78),
    (56, 21, 98),
    (24, 18, 43),
    (34, 15, 67)
)
The data is stored in a tuple of tuples.
for row in rows:
    sheet.append(row)
We go through the container row by row and insert the data row with the append method.
Openpyxl read cell
In the following example, we read the previously written data from the sample.xlsx file.
#!/usr/bin/env python

import openpyxl

book = openpyxl.load_workbook('sample.xlsx')

sheet = book.active

a1 = sheet['A1']
a2 = sheet['A2']
a3 = sheet.cell(row=3, column=1)

print(a1.value)
print(a2.value)
print(a3.value)
The example loads an existing xlsx file and reads three cells.
book = openpyxl.load_workbook('sample.xlsx')
The file is opened with the load_workbook method.
a1 = sheet['A1']
a2 = sheet['A2']
a3 = sheet.cell(row=3, column=1)
We read the contents of the A1, A2, and A3 cells. In the third line, we use the cell method to get the value of A3 cell.
$ ./read_cells.py
56
43
10/26/16
This is the output of the example.
Openpyxl read multiple cells
We have the following data sheet:
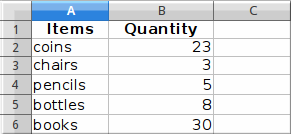
We read the data using a range operator.
#!/usr/bin/env python

import openpyxl

book = openpyxl.load_workbook('items.xlsx')

sheet = book.active

cells = sheet['A1': 'B6']

for c1, c2 in cells:
    print("{0:8} {1:8}".format(c1.value, c2.value))
In the example, we read data from two columns using a range operation.
cells = sheet['A1': 'B6']
In this line, we read data from cells A1 - B6.
for c1, c2 in cells:
    print("{0:8} {1:8}".format(c1.value, c2.value))
The format() function is used for neat output of data on the console.
$ ./read_cells2.py
Items    Quantity
coins          23
chairs          3
pencils         5
bottles         8
books          30
This is the output of the program.
Openpyxl iterate by rows
The iter_rows method return cells from the worksheet as rows.
#!/usr/bin/env python

from openpyxl import Workbook

book = Workbook()
sheet = book.active

rows = (
    (88, 46, 57),
    (89, 38, 12),
    (23, 59, 78),
    (56, 21, 98),
    (24, 18, 43),
    (34, 15, 67)
)

for row in rows:
    sheet.append(row)

for row in sheet.iter_rows(min_row=1, min_col=1, max_row=6, max_col=3):
    for cell in row:
        print(cell.value, end=" ")
    print()

book.save('iterbyrows.xlsx')
The example iterates over data row by row.
for row in sheet.iter_rows(min_row=1, min_col=1, max_row=6, max_col=3):
We provide the boundaries for the iteration.
$ ./iterating_by_rows.py
88 46 57
89 38 12
23 59 78
56 21 98
24 18 43
34 15 67
This is the output of the example.
Openpyxl iterate by columns
The iter_cols method return cells from the worksheet as columns.
#!/usr/bin/env python

from openpyxl import Workbook

book = Workbook()
sheet = book.active

rows = (
    (88, 46, 57),
    (89, 38, 12),
    (23, 59, 78),
    (56, 21, 98),
    (24, 18, 43),
    (34, 15, 67)
)

for row in rows:
    sheet.append(row)

for row in sheet.iter_cols(min_row=1, min_col=1, max_row=6, max_col=3):
    for cell in row:
        print(cell.value, end=" ")
    print()

book.save('iterbycols.xlsx')
The example iterates over data column by column.
$ ./iterating_by_columns.py
88 89 23 56 24 34
46 38 59 21 18 15
57 12 78 98 43 67
This is the output of the example.
Statistics
For the next example, we need to create a xlsx file containing numbers. For instance, we have created 25 rows of numbers in 10 columns with the RANDBETWEEN() function.
#!/usr/bin/env python

import openpyxl
import statistics as stats

book = openpyxl.load_workbook('numbers.xlsx', data_only=True)

sheet = book.active

rows = sheet.rows

values = []

for row in rows:
    for cell in row:
        values.append(cell.value)

print("Number of values: {0}".format(len(values)))
print("Sum of values: {0}".format(sum(values)))
print("Minimum value: {0}".format(min(values)))
print("Maximum value: {0}".format(max(values)))
print("Mean: {0}".format(stats.mean(values)))
print("Median: {0}".format(stats.median(values)))
print("Standard deviation: {0}".format(stats.stdev(values)))
print("Variance: {0}".format(stats.variance(values)))
In the example, we read all values from the sheet and compute some basic statistics.
import statistics as stats
The statistics module is imported to provide some statistical functions, such as median and variance.
book = openpyxl.load_workbook('numbers.xlsx', data_only=True)
Using the data_only option, we get the values from the cells, not the formula.
rows = sheet.rows
We get all the rows of cells that are not empty.
for row in rows:
    for cell in row:
        values.append(cell.value)
In two for loops, we form a list of integer values from the cells.
print("Number of values: {0}".format(len(values)))
print("Sum of values: {0}".format(sum(values)))
print("Minimum value: {0}".format(min(values)))
print("Maximum value: {0}".format(max(values)))
print("Mean: {0}".format(stats.mean(values)))
print("Median: {0}".format(stats.median(values)))
print("Standard deviation: {0}".format(stats.stdev(values)))
print("Variance: {0}".format(stats.variance(values)))
We compute and print mathematical statistics about the values. Some of the functions are built-in, others are imported with the statistics module.
$ ./mystats.py
Number of values: 312
Sum of values: 15877
Minimum value: 0
Maximum value: 100
Mean: 50.88782051282051
Median: 54.0
Standard deviation: 28.459203819700967
Variance: 809.9262820512821
This is a sample output.
Openpyxl filter & sort data
A sheet has an auto_filter attribute, which allows to set filtering and sorting conditions.
Note that Openpyxl sets the conditions but we must apply them inside the Spreadsheet application.
#!/usr/bin/env python

from openpyxl import Workbook

wb = Workbook()
sheet = wb.active

data = [
    ['Item', 'Colour'],
    ['pen', 'brown'],
    ['book', 'black'],
    ['plate', 'white'],
    ['chair', 'brown'],
    ['coin', 'gold'],
    ['bed', 'brown'],
    ['notebook', 'white'],
]

for r in data:
    sheet.append(r)

sheet.auto_filter.ref = 'A1:B8'
sheet.auto_filter.add_filter_column(1, ['brown', 'white'])
sheet.auto_filter.add_sort_condition('B2:B8')

wb.save('filtered.xlsx')
In the example, we create a sheet with items and their colours. We set a filter and a sort condition.
Openpyxl dimensions
To get those cells that actually contain data, we can use dimensions.
#!/usr/bin/env python

from openpyxl import Workbook

book = Workbook()
sheet = book.active

sheet['A3'] = 39
sheet['B3'] = 19

rows = [
    (88, 46),
    (89, 38),
    (23, 59),
    (56, 21),
    (24, 18),
    (34, 15)
]

for row in rows:
    sheet.append(row)

print(sheet.dimensions)
print("Minimum row: {0}".format(sheet.min_row))
print("Maximum row: {0}".format(sheet.max_row))
print("Minimum column: {0}".format(sheet.min_column))
print("Maximum column: {0}".format(sheet.max_column))

for c1, c2 in sheet[sheet.dimensions]:
    print(c1.value, c2.value)

book.save('dimensions.xlsx')
The example calculates the dimensions of two columns of data.
sheet['A3'] = 39
sheet['B3'] = 19

rows = [
    (88, 46),
    (89, 38),
    (23, 59),
    (56, 21),
    (24, 18),
    (34, 15)
]

for row in rows:
    sheet.append(row)
We add data to the worksheet. Note that we start adding from the third row.
print(sheet.dimensions)
The dimensions property returns the top-left and bottom-right cell of the area of non-empty cells.
print("Minimum row: {0}".format(sheet.min_row))
print("Maximum row: {0}".format(sheet.max_row))
Witht the min_row and max_row properties, we get the minimum and maximum row containing data.
print("Minimum column: {0}".format(sheet.min_column))
print("Maximum column: {0}".format(sheet.max_column))
With the min_column and max_column properties, we get the minimum and maximum column containing data.
for c1, c2 in sheet[sheet.dimensions]:
    print(c1.value, c2.value)
We iterate through the data and print it to the console.
$ ./dimensions.py
A3:B9
Minimum row: 3
Maximum row: 9
Minimum column: 1
Maximum column: 2
39 19
88 46
89 38
23 59
56 21
24 18
34 15
This is the output of the example.
Sheets
Each workbook can have multiple sheets.
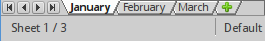
Let's have a workbook with these three sheets.
#!/usr/bin/env python

import openpyxl

book = openpyxl.load_workbook('sheets.xlsx')

print(book.get_sheet_names())

active_sheet = book.active
print(type(active_sheet))

sheet = book.get_sheet_by_name("March")
print(sheet.title)
The program works with Excel sheets.
print(book.get_sheet_names())
The get_sheet_names method returns the names of available sheets in a workbook.
active_sheet = book.active
print(type(active_sheet))
We get the active sheet and print its type to the terminal.
sheet = book.get_sheet_by_name("March")
We get a reference to a sheet with the get_sheet_by_name() method.
print(sheet.title)
The title of the retrieved sheet is printed to the terminal.
$ ./sheets.py
['January', 'February', 'March']
<class 'openpyxl.worksheet.worksheet.Worksheet'>
March
This is the output of the program.
#!/usr/bin/env python

import openpyxl

book = openpyxl.load_workbook('sheets.xlsx')

book.create_sheet("April")

print(book.sheetnames)

sheet1 = book.get_sheet_by_name("January")
book.remove_sheet(sheet1)

print(book.sheetnames)

book.create_sheet("January", 0)
print(book.sheetnames)

book.save('sheets2.xlsx')
In this example, we create a new sheet.
book.create_sheet("April")
A new sheet is created with the create_sheet method.
print(book.sheetnames)
The sheet names can be shown with the sheetnames attribute as well.
book.remove_sheet(sheet1)
A sheet can be removed with the remove_sheet method.
book.create_sheet("January", 0)
A new sheet can be created at the specified position; in our case, we create a new sheet at position with index 0.
$ ./sheets2.py
['January', 'February', 'March', 'April']
['February', 'March', 'April']
['January', 'February', 'March', 'April']
This is the output of the program.
It is possible to change the background colour of a worksheet.
#!/usr/bin/env python

import openpyxl

book = openpyxl.load_workbook('sheets.xlsx')

sheet = book.get_sheet_by_name("March")
sheet.sheet_properties.tabColor = "0072BA"

book.save('sheets3.xlsx')
The example modifies the background colour of the sheet titled "March".
sheet.sheet_properties.tabColor = "0072BA"
We change the tabColor property to a new colour.
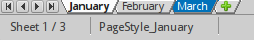
The background colour of the third worksheet has been changed to some blue colour.
Merging cells
Cells can be merged with the merge_cells method and unmerged with the unmerge_cells method. When we merge cells, all cells but the top-left one are removed from the worksheet.
#!/usr/bin/env python

from openpyxl import Workbook
from openpyxl.styles import Alignment

book = Workbook()
sheet = book.active

sheet.merge_cells('A1:B2')

cell = sheet.cell(row=1, column=1)
cell.value = 'Sunny day'
cell.alignment = Alignment(horizontal='center', vertical='center')

book.save('merging.xlsx')
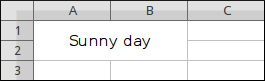
In the example, we merge four cells: A1, B1, A2, and B2. The text in the final cell is centered.
from openpyxl.styles import Alignment
In order to center a text in the final cell, we use the Alignment class from the openpyxl.styles module.
sheet.merge_cells('A1:B2')
We merge four cells with the merge_cells method.
cell = sheet.cell(row=1, column=1)
We get the final cell.
cell.value = 'Sunny day'
cell.alignment = Alignment(horizontal='center', vertical='center')
We set text to the merged cell and update its alignment.
Openpyxl freeze panes
When we freeze panes, we keep an area of a worksheet visible while scrolling to another area of the worksheet.
#!/usr/bin/env python

from openpyxl import Workbook
from openpyxl.styles import Alignment

book = Workbook()
sheet = book.active

sheet.freeze_panes = 'B2'

book.save('freezing.xlsx')
The example freezes panes by the cell B2.
sheet.freeze_panes = 'B2'
To freeze panes, we use the freeze_panes property.
Openpyxl formulas
The next example shows how to use formulas. The openpyxl does not do calculations; it writes formulas into cells.
#!/usr/bin/env python

from openpyxl import Workbook

book = Workbook()
sheet = book.active

rows = (
    (34, 26),
    (88, 36),
    (24, 29),
    (15, 22),
    (56, 13),
    (76, 18)
)

for row in rows:
    sheet.append(row)

cell = sheet.cell(row=7, column=2)
cell.value = "=SUM(A1:B6)"
cell.font = cell.font.copy(bold=True)

book.save('formulas.xlsx')
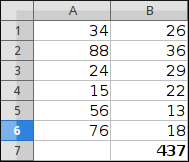
In the example, we calculate the sum of all values with the SUM() function and style the output in bold font.
rows = (
    (34, 26),
    (88, 36),
    (24, 29),
    (15, 22),
    (56, 13),
    (76, 18)
)

for row in rows:
    sheet.append(row)
We create two columns of data.
cell = sheet.cell(row=7, column=2)
We get the cell where we show the result of the calculation.
cell.value = "=SUM(A1:B6)"
We write a formula into the cell.
cell.font = cell.font.copy(bold=True)
We change the font style.
Openpyxl images
In the following example, we show how to insert an image into a sheet.
#!/usr/bin/env python

from openpyxl import Workbook
from openpyxl.drawing.image import Image

book = Workbook()
sheet = book.active

img = Image("icesid.png")
sheet['A1'] = 'This is Sid'

sheet.add_image(img, 'B2')

book.save("sheet_image.xlsx")
In the example, we write an image into a sheet.
from openpyxl.drawing.image import Image
We work with the Image class from the openpyxl.drawing.image module.
img = Image("icesid.png")
A new Image class is created. The icesid.png image is located in the current working directory.
sheet.add_image(img, 'B2')
We add a new image with the add_image method.
Openpyxl Charts
The openpyxl library supports creation of various charts, including bar charts, line charts, area charts, bubble charts, scatter charts, and pie charts.
According to the documentation, openpyxl supports chart creation within a worksheet only. Charts in existing workbooks will be lost.
#!/usr/bin/env python

from openpyxl import Workbook
from openpyxl.chart import (
    Reference,
    Series,
    BarChart
)

book = Workbook()
sheet = book.active

rows = [
    ("USA", 46),
    ("China", 38),
    ("UK", 29),
    ("Russia", 22),
    ("South Korea", 13),
    ("Germany", 11)
]

for row in rows:
    sheet.append(row)

data = Reference(sheet, min_col=2, min_row=1, max_col=2, max_row=6)
categs = Reference(sheet, min_col=1, min_row=1, max_row=6)

chart = BarChart()
chart.add_data(data=data)
chart.set_categories(categs)

chart.legend = None
chart.y_axis.majorGridlines = None
chart.varyColors = True
chart.title = "Olympic Gold medals in London"

sheet.add_chart(chart, "A8")

book.save("bar_chart.xlsx")
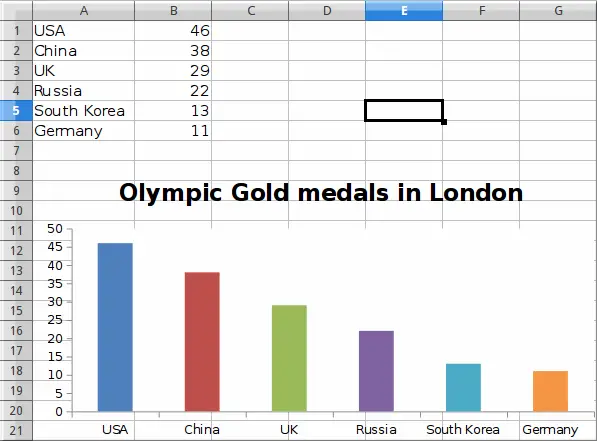
In the example, we create a bar chart to show the number of Olympic gold medals per country in London 2012.
from openpyxl.chart import (
    Reference,
    Series,
    BarChart
)
The openpyxl.chart module has tools to work with charts.
book = Workbook()
sheet = book.active
A new workbook is created.
rows = [
    ("USA", 46),
    ("China", 38),
    ("UK", 29),
    ("Russia", 22),
    ("South Korea", 13),
    ("Germany", 11)
]

for row in rows:
    sheet.append(row)
We create some data and add it to the cells of the active sheet.
data = Reference(sheet, min_col=2, min_row=1, max_col=2, max_row=6)
With the Reference class, we refer to the rows in the sheet that represent data. In our case, these are the numbers of olympic gold medals.
categs = Reference(sheet, min_col=1, min_row=1, max_row=6)
We create a category axis. A category axis is an axis with the data treated as a sequence of non-numerical text labels. In our case, we have text labels representing names of countries.
chart = BarChart()
chart.add_data(data=data)
chart.set_categories(categs)
We create a bar chart and set it data and categories.
chart.legend = None
chart.y_axis.majorGridlines = None
Using legend and majorGridlines attributes, we turn off the legends and major grid lines.
chart.varyColors = True
Setting varyColors to True, each bar has a different colour.
chart.title = "Olympic Gold medals in London"
A title is set for the chart.
sheet.add_chart(chart, "A8")
The created chart is added to the sheet with the add_chart method.
In this tutorial, we have worked with the openpyxl library. We have read data from an Excel file, written data to an Excel file.

